See How Your Teachers and Students Are Using Wayground
1759733490688
What it does
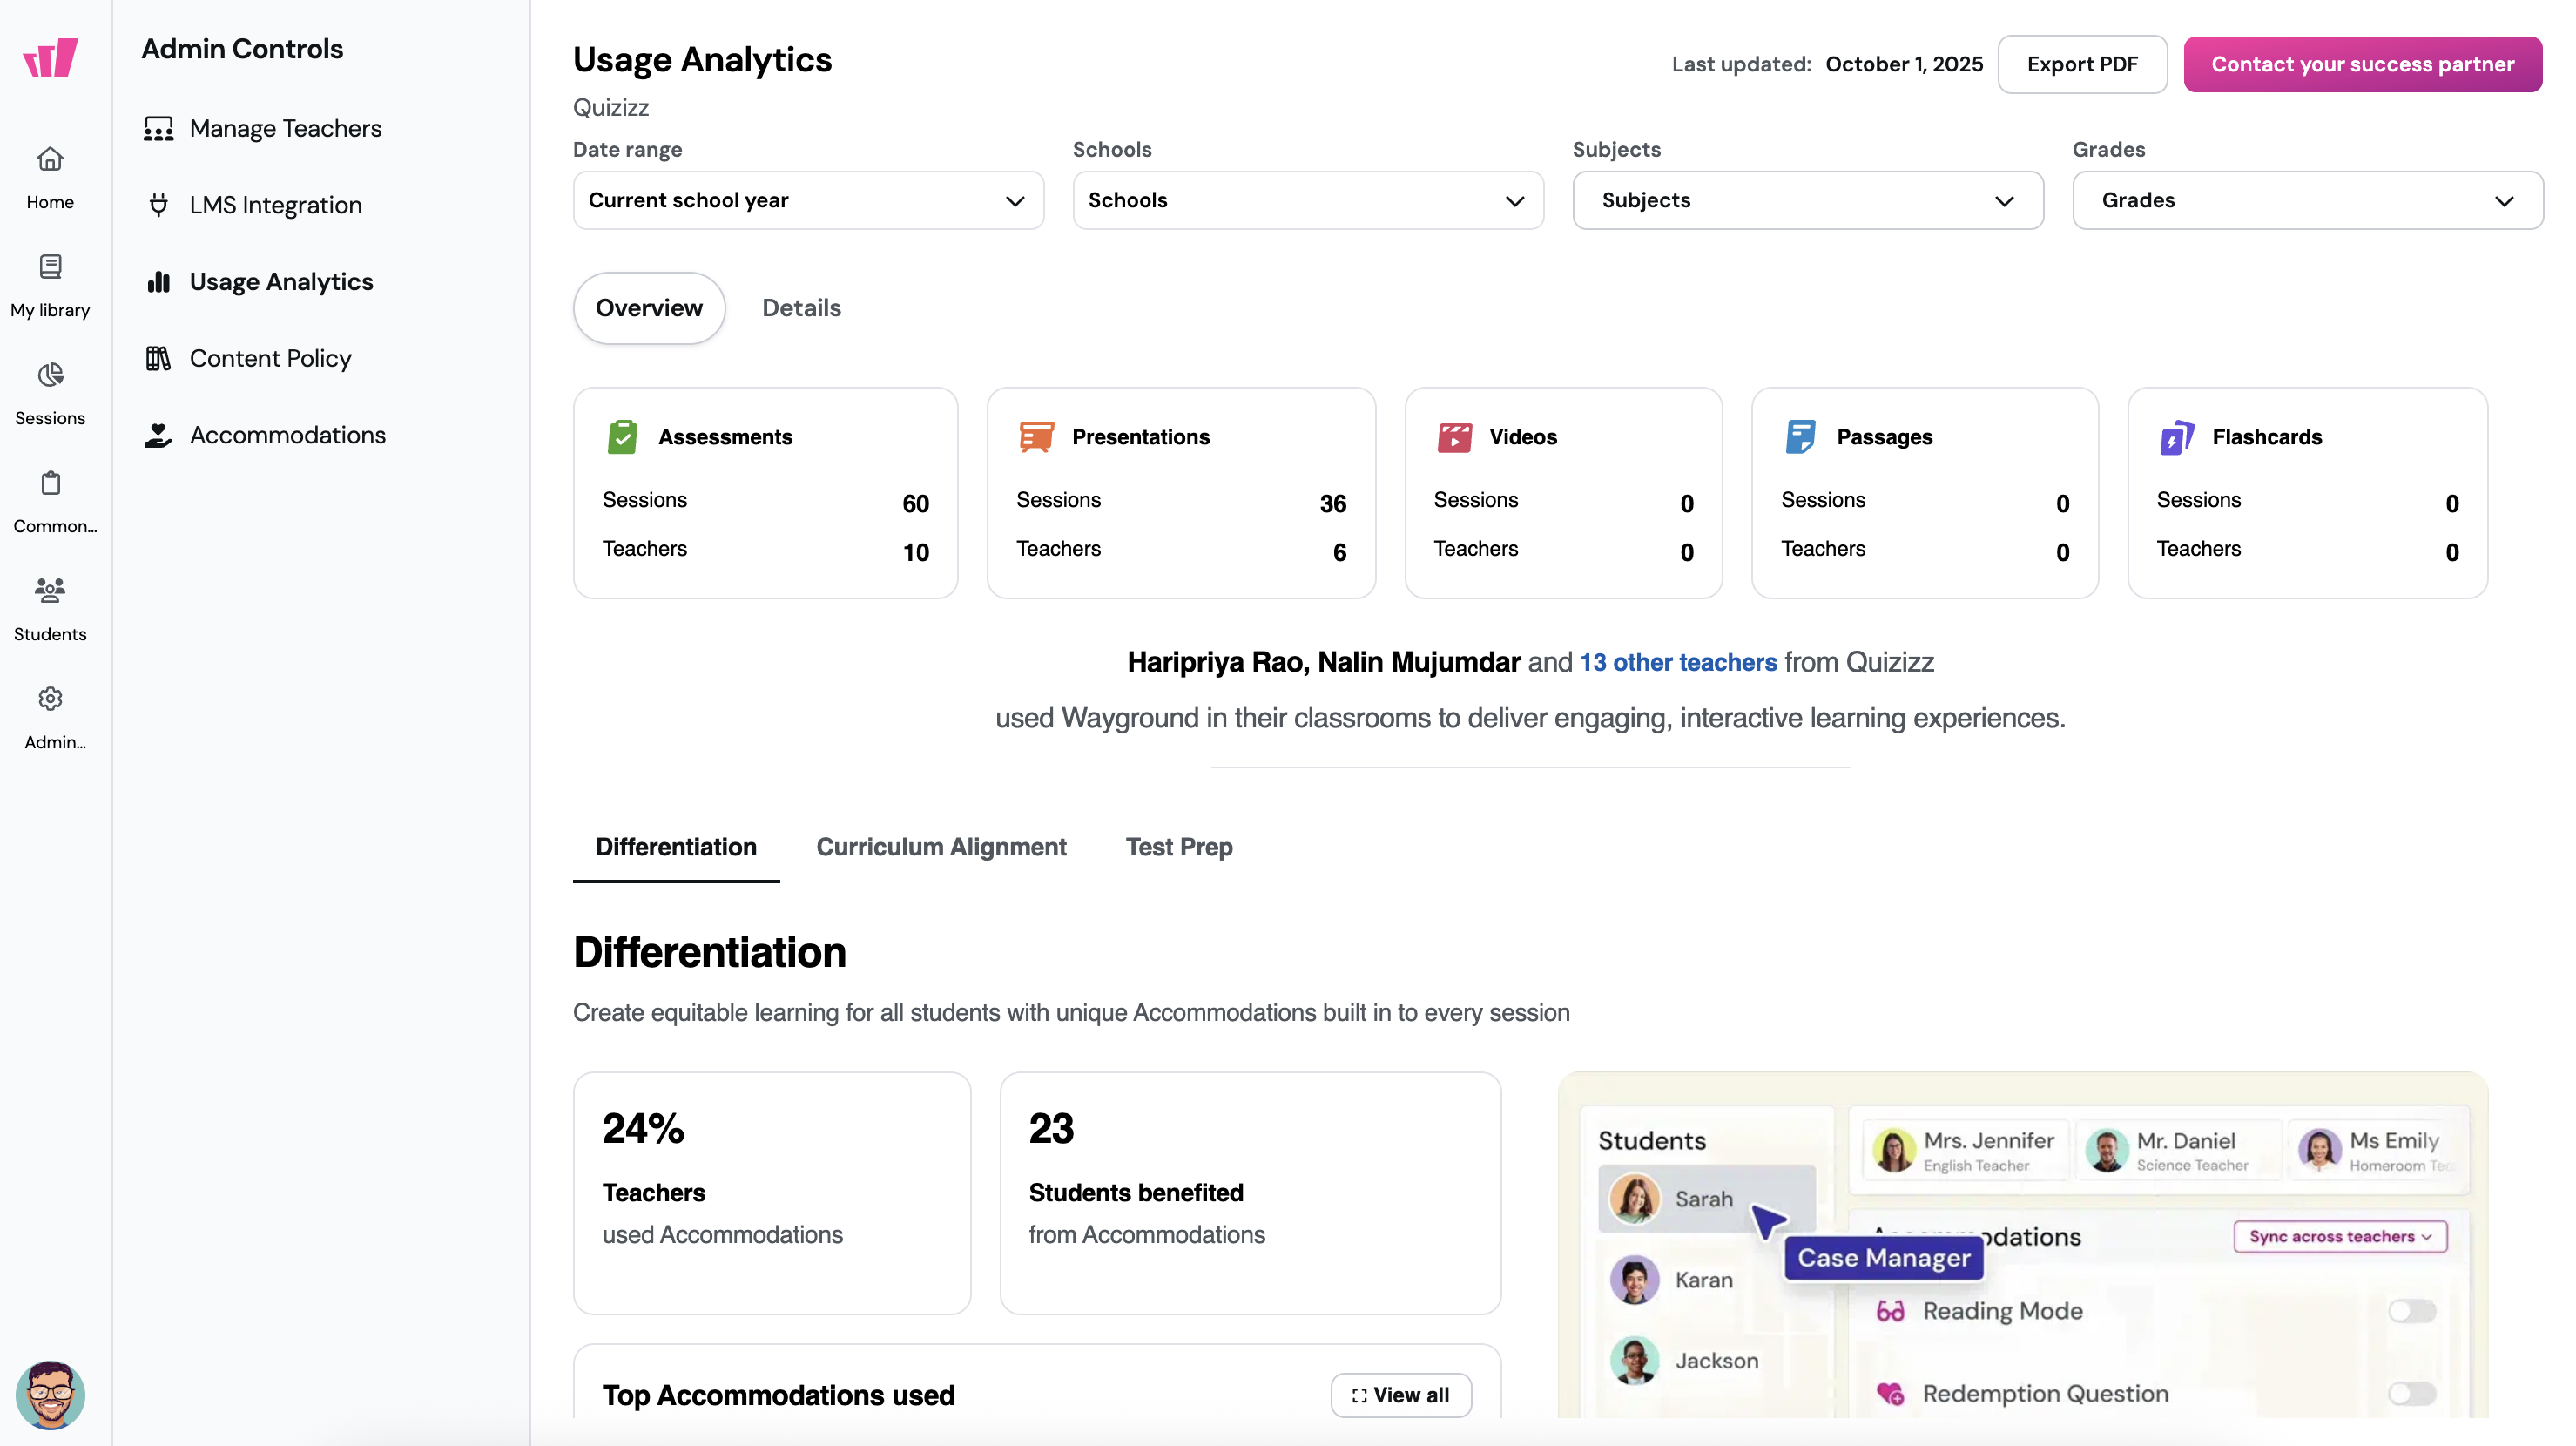
The Usage Analytics dashboard gives school and district leaders a clear view of how teachers and students are using Wayground. Whether you're tracking adoption, identifying equity gaps, or prepping for a board meeting, this dashboard puts key data at your fingertips.
How it works
Here's what you can explore:
Cross-format Usage Overview: Get a breakdown of sessions across Assessments, Presentations, Videos, Passages, and Flashcards - plus how many teachers use each
Differentiation Insights: See how many teachers are using Accommodations, which ones are most common, and how many students they impact
Curriculum Alignment: Check how many teachers use standards-aligned resources and which standards get the most use
State Test Prep: Explore the types of higher-order thinking questions being used and who's adopting them
Leaderboards: Highlight top schools and teachers by sessions, sortable by any metric
Smart Filters: Drill down by date, school, subject, and grade
Example in action
You're a district instructional lead reviewing middle school reading comprehension initiatives. In the dashboard, you filter by ELA, grades 6–8, and see that 78% of teachers are using standards-aligned Passages. You spot one school leading in usage—and one that's lagging. Now you know where to focus support, and you've got data to back it up.