Get faster, clearer answers from your Usage Analytics dashboard
1772716420510
What it does
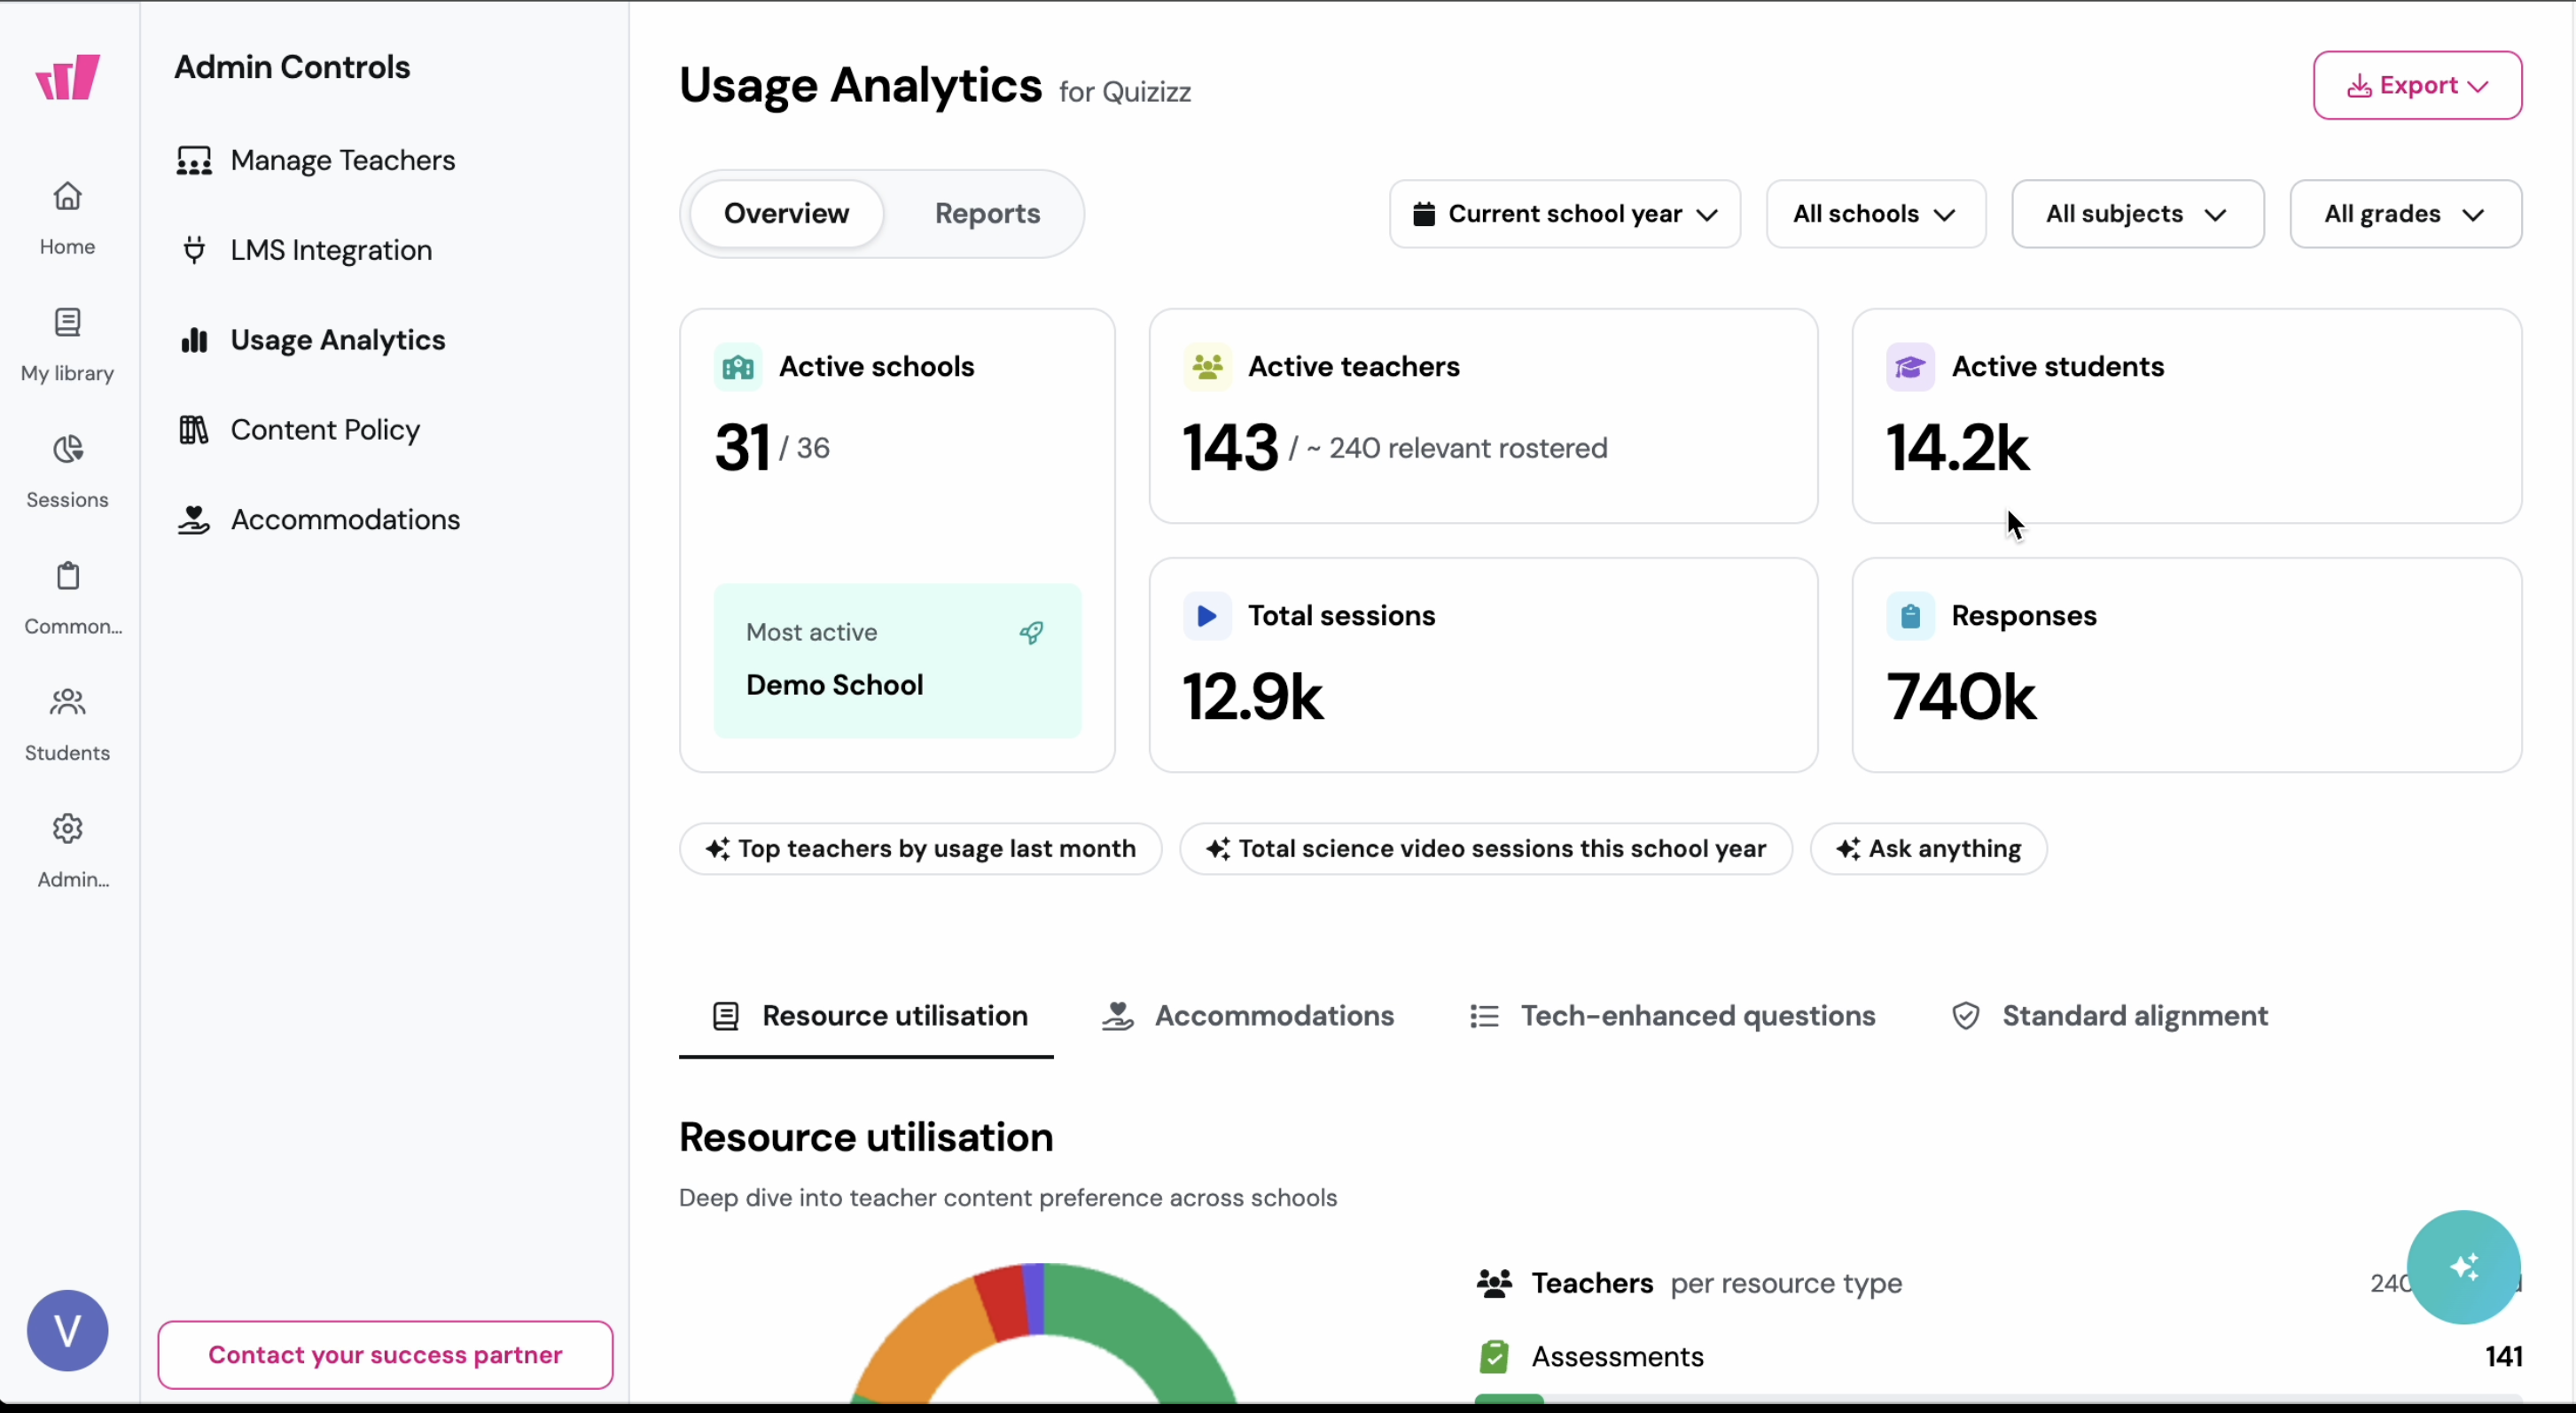
Usage Analytics is now easier to scan and more useful when you need answers quickly. You can ask Wayground AI questions right on the dashboard, see new top-level metrics at a glance, and use refreshed Overview and Reports layouts that reduce clutter and improve readability.
Wayground AI responses are limited to the metrics already in the report and only show data from your organization, so you can trust what you are seeing.
How it works
Open Usage Analytics
Use the Wayground AI chat on the dashboard to ask a question (for example, “How many active students do we have this month?”)
Review the result, which may appear as a number, table, or chart
Use the updated top-level metrics to check org-wide activity, including active schools, teachers, and students, plus total sessions and responses
On the Reports page, switch between tabs to view combined “Top schools” and “Top teachers,” plus more detailed feature views
Example in action
As a school or district admin, you are prepping for a monthly check-in and needs a fast snapshot of engagement. In Usage Analytics, ask Wayground AI, “Show total sessions and responses for the last 30 days,” then scan the updated charts for format usage. In the Reports tabbed view, quickly compare top schools versus top teachers, and walk into the meeting with clear, shareable data.