



Build a custom report for standards mastery or a full year of assessments
1787042059307
What it does
Custom Reports lets you pull the assessments that matter into one report, instead of opening each one separately. You pick the roster, the scope, and which assessments to include. There are two kinds.
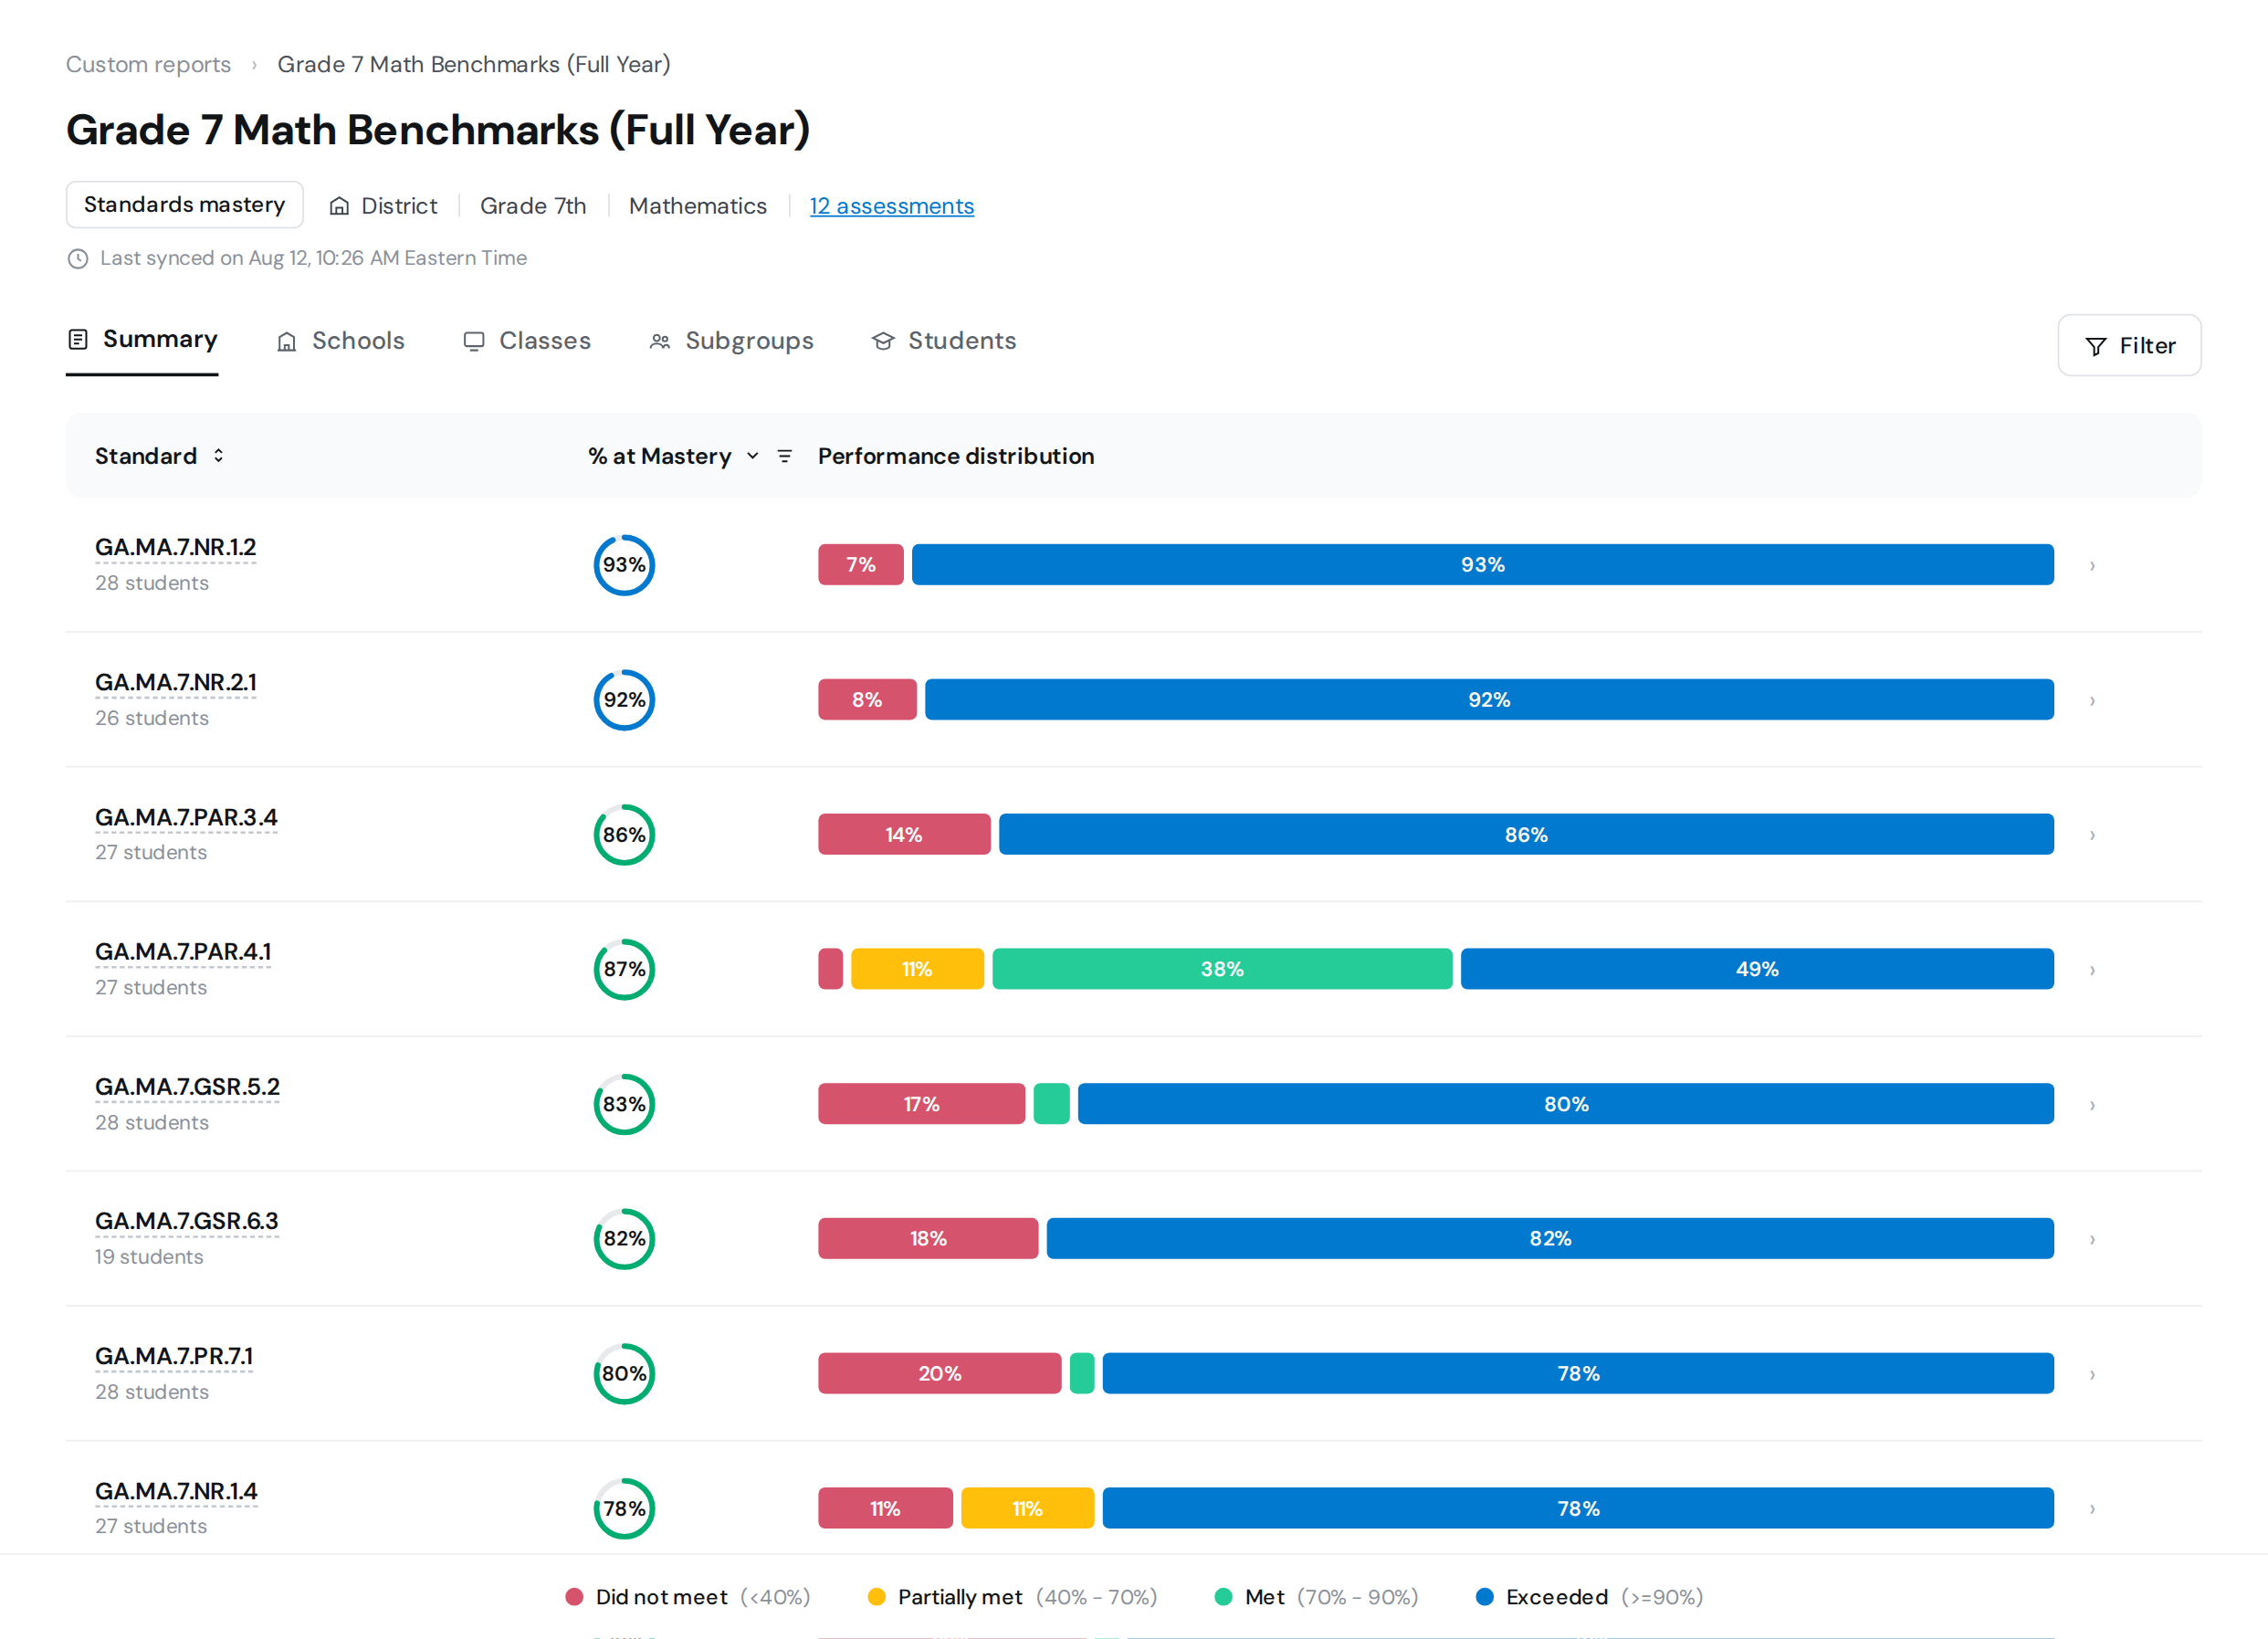
A standards mastery report shows which standards students have and haven't mastered, from the district level down to a single student. When a standard appears on more than one assessment you picked, you decide how it counts, either by most recent, recency-weighted, straight average, or highest score, so "Met" reflects the rule your team chose rather than a default.
A multi-assessment analysis puts two or more assessments side by side, and they don't all have to be Wayground. Read iReady, NWEA MAP, Renaissance Star, or your state test against your own benchmarks in one view, with each assessment keeping its own performance bands so a rigorous test and a lighter one aren't forced onto one scale. For teachers, that same view works as a gradebook.
How it works
Open Reports, go to Custom reports, and click Create new report
Name the report and select the type, either Standards mastery report or Multi-assessment analysis
Set the roster the report follows, then choose the grade and subject
Select the assessments you want to compare
Review how accuracy is calculated and where your performance bands sit, then save
For the roster, teachers can use their Wayground classes or, when the district connects Clever or ClassLink, an SIS enrollment snapshot from a selected date. A multi-assessment analysis skips the last step because each assessment has its own bands.
The Custom Reports Help Center has separate walkthroughs for admins and teachers, plus detailed guides for the grouping and accuracy options.
Custom reports is available to US schools and districts with Common Assessments access.
Example in action
Your district gives four math benchmarks a year, and the fall results look healthy in aggregate. You build a standards mastery report scoped to your middle schools and sort by lowest mastery. Two ratio and proportional relationships standards are below 50%, and the subgroup view shows the gap isn't evenly distributed across your student groups. You take that to your math content lead with the schools, classes, and standards already named.
What did you think about this update?


Leave your name and email so that we can reply to you (both fields are optional):
